Model Interpretation
from ngboost import NGBClassifier, NGBRegressor
from ngboost.distns import k_categorical, Normal
from ngboost.scores import LogScore

from sklearn.datasets import load_breast_cancer, load_boston
from sklearn.model_selection import train_test_split

X, Y = load_boston(True)
X_reg_train, X_reg_test, Y_reg_train, Y_reg_test = train_test_split(X, Y, test_size=0.2)

X, y = load_breast_cancer(True)
y[0:15] = 2 # artificially make this a 3-class problem instead of a 2-class problem
X_cls_train, X_cls_test, Y_cls_train, Y_cls_test  = train_test_split(X, y, test_size=0.2)
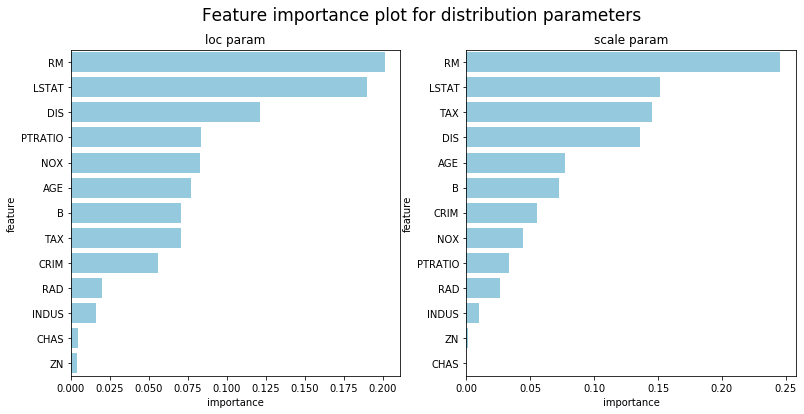
We caution users against trying to interpret too much from any machine learning model, but NGBoost does provide methods to interpret models fit with regression tree base learners. Since each parameter in the distribution is fit by a separate sequence of learners, there will be multiple model interpretation results, one for each parameter. The default distribution used is Normal so the following example shows results for the loc and scale parameters.
ngb = NGBRegressor(verbose=False).fit(X_reg_train, Y_reg_train)

## Feature importance for loc trees
feature_importance_loc = ngb.feature_importances_[0]

## Feature importance for scale trees
feature_importance_scale = ngb.feature_importances_[1]
import pandas as pd
import matplotlib.pyplot as plt
import seaborn as sns

df_loc = pd.DataFrame({'feature':load_boston()['feature_names'],
                       'importance':feature_importance_loc})\
    .sort_values('importance',ascending=False)
df_scale = pd.DataFrame({'feature':load_boston()['feature_names'],
                       'importance':feature_importance_scale})\
    .sort_values('importance',ascending=False)

fig, (ax1, ax2) = plt.subplots(1, 2, figsize=(13,6))
fig.suptitle("Feature importance plot for distribution parameters", fontsize=17)
sns.barplot(x='importance',y='feature',ax=ax1,data=df_loc, color="skyblue").set_title('loc param')
sns.barplot(x='importance',y='feature',ax=ax2,data=df_scale, color="skyblue").set_title('scale param')
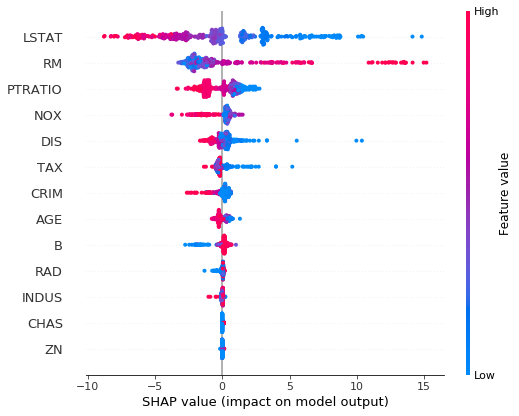
import shap
shap.initjs()

## SHAP plot for loc trees
explainer = shap.TreeExplainer(ngb, model_output=0) # use model_output = 1 for scale trees
shap_values = explainer.shap_values(X_reg_train)
shap.summary_plot(shap_values, X_reg_train, feature_names=load_boston()['feature_names'])