We developed and deployed a deep learning model called OGNet to detect oil and gas infrastructure in aerial imagery.

At least a quarter of the warming that the Earth is experiencing today is due to anthropogenic methane emissions, with emissions from the oil and gas sector significantly contributing to the total anthropogenic methane budget. There are multiple satellites in orbit and planned for launch in the next few years which can detect and quantify these emissions; however, to attribute methane emissions to their sources on the ground, a comprehensive database of the locations and characteristics of emission sources worldwide is essential. Deep learning on remotely-sensed imagery has the potential to automatically detect and create a global database of oil and gas infrastructure.

Read The Paper (Sheng & Irvin et al.)

We curated a dataset of aerial imagery capturing oil refineries.

The dataset consists of 7,066 aerial images in total, with 149 images of oil refineries and 6,917 negative images containing visually similar objects and landscapes around oil refineries. We used aerial imagery between 2015 and 2019 from the National Agriculture Imagery Program (NAIP), which captures the continental U.S. at a minimum of 1m resolution. The images are mosaics of the most recent captures of the location and do not suffer from cloud cover or haze because images were acquired aerially on days with low cloud cover. Imagery was processed and downloaded using the Descartes Labs platform. The dataset can be downloaded below (CC BY 4.0 License).

Download the Dataset

We developed and deployed a deep learning model called OGNet to classify imagery for the presence of oil refineries.

For a single image, OGNet produces a probability that the image contains an oil and gas facility. In order to convert the probability to a binary prediction, we used the threshold that lead to the highest precision (0.81) subject to a recall of 1.0 on the validation set.

To identify infrastructure in the continental U.S. using OGNet, we partition the region into equal 500 x 500 pixel tiles at 2.5m resolution leading to 5,082,722 tiles in total and run each of the tiles through OGNet. Any tile which was assigned a positive prediction is greedily merged with any positively classified adjacent tiles, and the mean of the centroids of each of the tiles within the merged group is used as the detected location.

OGNet detections were manually reviewed and all false positive detections were removed. We discovered that OGNet was able to detect oil and gas facilities other than oil refineries, so the remaining facilities were classified as oil refineries or petroleum terminals. During this process, we also identified the number of storage tanks at each facility. An expert interpreter designed the annotation procedure and verified the detected facilities and their attributed characteristics.

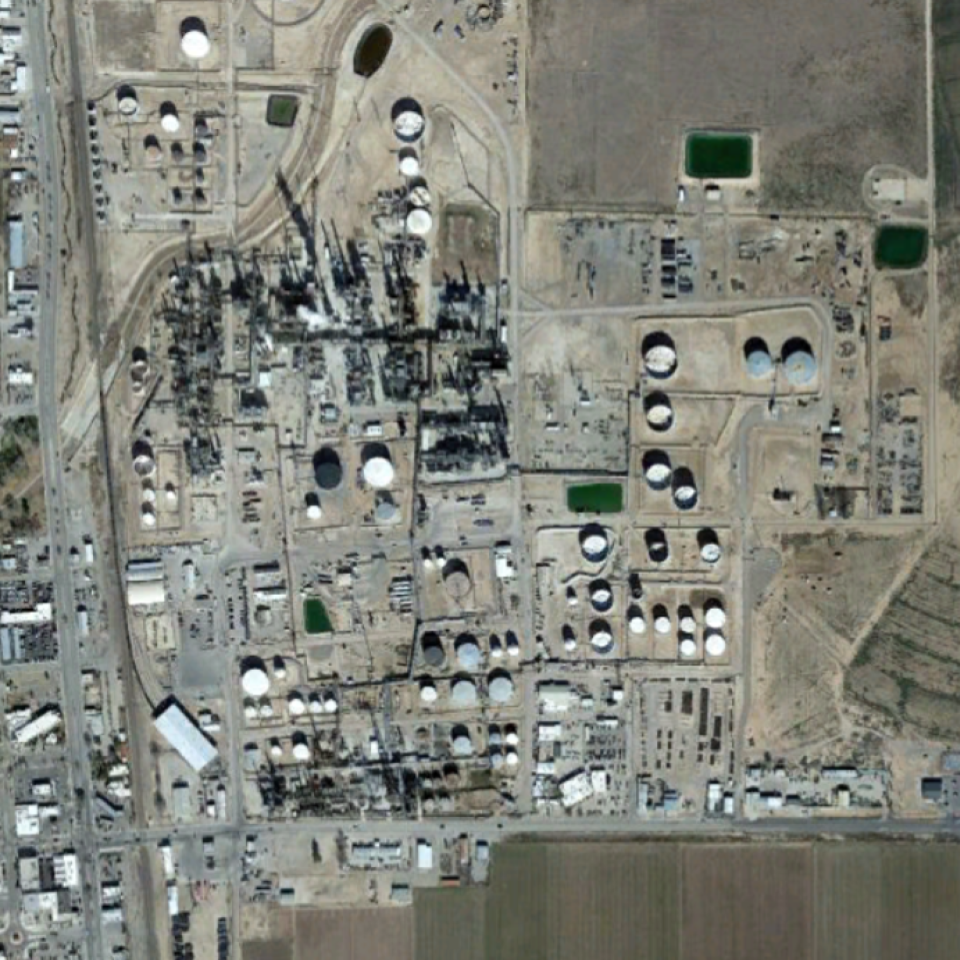
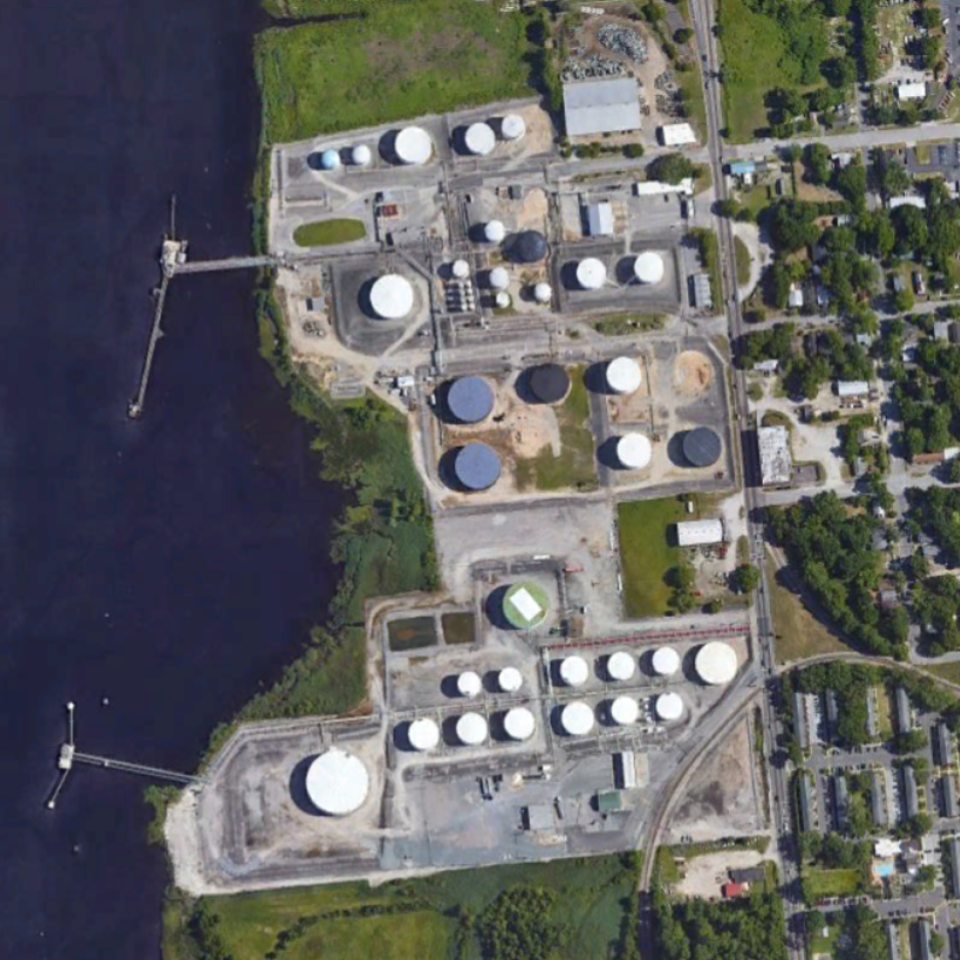
OGNet detected several oil and gas facilities not present in four publicly available datasets.

We compared the manually verified facilities detected by OGNet by combining four publicly available datasets, namely GOGI, GHGRP, HIFLD, and EIA. We removed duplicate records by combining coordinates within 2 km of each other.

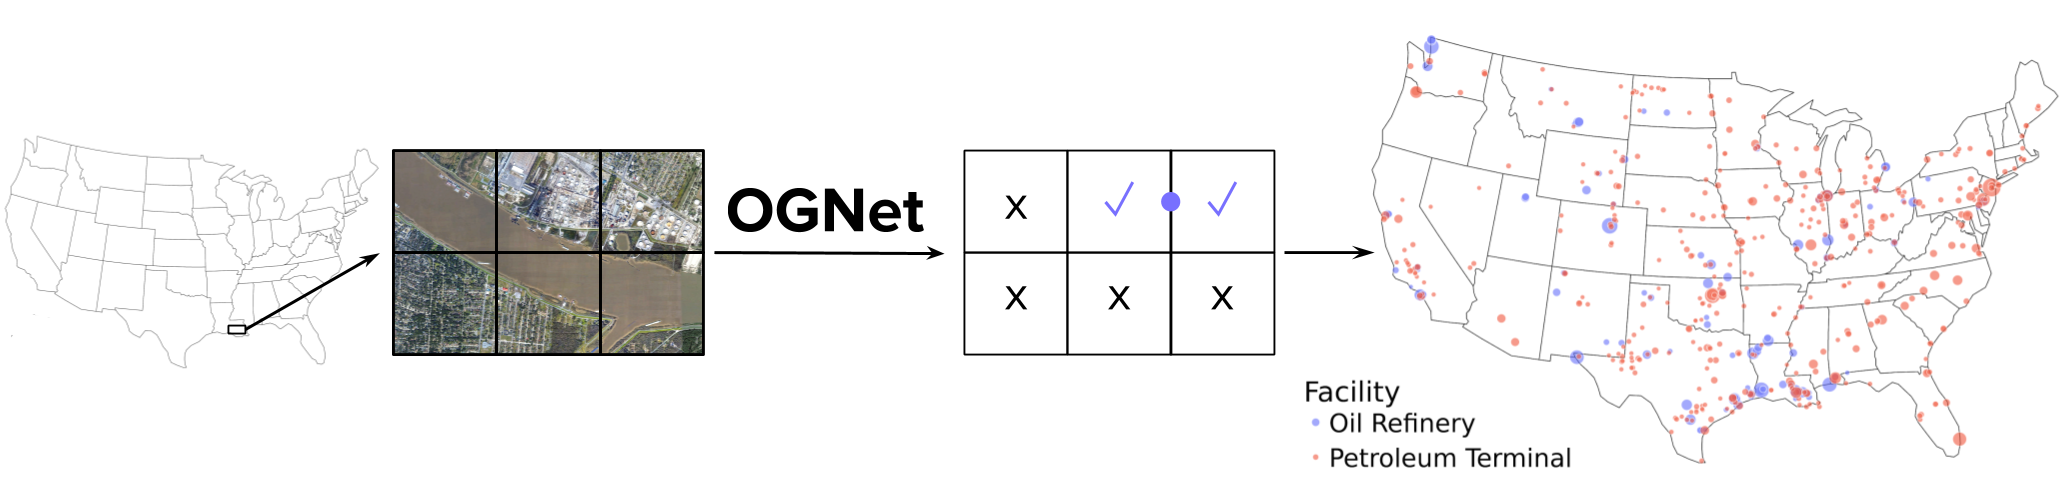
We counted the number of reported facilities which were detected by OGNet, and found it detected 73.5% of the oil refineries and 23.9% of the petroleum terminals in the combined dataset. Close to half of the "missed" oil refineries were due to inaccurate locations reported in the public datasets.

We counted the number of detected facilities which neither occur in the combined public dataset nor the training set, and found that OGNet detected 6 new oil refineries (including one abandoned facility) and 142 new petroleum terminals.

Download OGNet Detections (v1.0)

Each detection is associated with a latitude and longitude, facility type, storage tank count, and whether the detection corresponds to multiple adjacent facilities.

Disclaimer: This is the first version of the database produced by OGNet and has limitations which should be considered carefully.

  • NAIP imagery does not always provide a very recent capture of a location (see NAIP Status Maps). Results could differ with other imagery sources.
  • The locations of detections are restricted to the coverage of NAIP, which only captures the continental U.S.
  • The locations are not always centered on the facility.
  • The storage tank counts are not always exact.

Table 1. Statistics of the OGNet detections and comparison to benchmark datasets.

Oil Refinery Petroleum Terminal
Total Detections114336
Coverage of Benchmark Datasets 73.5% (108 / 147)23.9% (292 / 1222)
New Detections 6142
Example Image

Check out the interactive map below, containing oil refineres detected by OGNet!

The radius of the circles is proportional to the number of storage tanks at each facility.

To learn more, read our publication presented at the NeurIPS 2020 workshop on Tackling Climate Change with Machine Learning.

If you have questions about our work, contact us at:

haosheng@cs.stanford.edu and jirvin16@cs.stanford.edu