What is METER-ML?

In support of a new initiative to build a global database of methane emitting infrastructure called the MEthane Tracking Emissions Reference (METER) database, we developed METER-ML, a multi-sensor Earth observation dataset containing georeferenced images in the U.S. labeled for the presence or absence of six methane source facilities.

Why did we develop METER-ML?

Reducing methane emissions is essential for mitigating global warming. To attribute methane emissions to their sources, a comprehensive dataset of methane source infrastructure is necessary. Recent advancements with deep learning on remotely sensed imagery have the potential to identify the locations and characteristics of methane sources, but there is a substantial lack of publicly available data to enable machine learning researchers and practitioners to build automated mapping approaches.

We developed METER-ML to allow the machine learning community to experiment with multi-view/multi-modal modeling approaches to automatically identify sources of methane emissions in remotely sensed imagery.

How did we collect and label METER-ML?

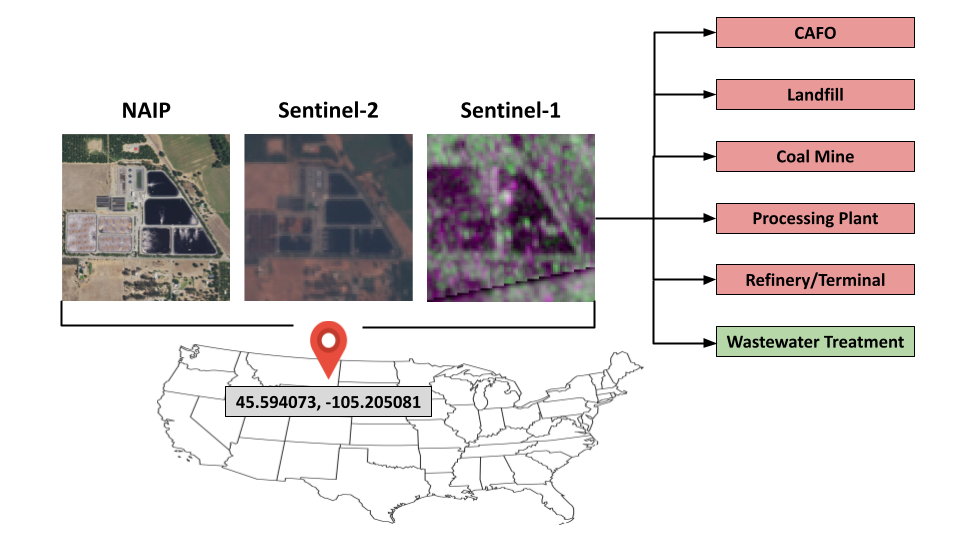
METER-ML consists of 86,625 georeferenced NAIP, Sentinel-1, and Sentinel-2 images in the U.S. labeled for the presence or absence of methane source facilities including concentrated animal feeding operations (CAFOs), coal mines, landfills, natural gas processing plants (Proc Plants), oil refineries and petroleum terminals (R&Ts), and wastewater treatment plants (WWTPs).

Images in METER-ML

We collected locations of methane emitting infrastructure in the U.S. from a variety of public datasets. We additionally included a variety of images in the dataset which capture none of the six methane emitting facilities (Negatives). All of the locations were paired with three publicly available remotely sensed image sources, namely aerial imagery from the USDA National Agriculture Imagery Program (NAIP) as well as satellite imagery captured by Sentinel-1 (S1) and Sentinel-2 (S2). We included the three visible (RGB) and single near-infrared (NIR) bands from NAIP and S2, the single coastal aerosol (CA) band, four red-edge (RE1-4) bands, single water vapor (WV) band, single cirrus (C) band, and the two shortwave infrared (SWIR1-2) bands from S2, and the V-transmit (VH and VV) bands from S1. Images capture a 720m x 720m footprint. Imagery was processed and downloaded using the Descartes Labs platform.

Expert-labeled Validation and Test Sets

Two Stanford University postdoctoral researchers with expertise in methane emissions and related infrastructure individually reviewed 1,534 examples to compose the held-out validation and test sets. Their consensus was used as the final label in these sets.

Table 1. Counts of each category in METER-ML.

Category TrainValidTestTotal
CAFOs24957479225096
Landfills4085461114242
Coal Mines177640721888
Proc Plants1900381072045
R&Ts4012591084179
WWTPs145194612914694
Negatives3419524942634870
Total85066515101886599

Table 2. Summary of the remotely sensed image products and bands included in METER-ML.

Product BandsImage SizeResolution
NAIPRGB & NIR720x7201m
Sentinel-2RGB & NIR72x7210m
Sentinel-2RE1-4 & SWIR1-236x3620m
Sentinel-2CA & WV & C12x1260m
Sentinel-1VH & VV72x7210m

Table 3. Per-class and overall (macros-average) test metrics of our baseline model.

Category AUPRCAUROCCPrecisionRecallF1
CAFOs0.9150.9890.8220.9020.860
Landfills0.2590.7540.2460.5230.334
Coal Mines0.4700.9050.5580.4030.468
Proc Plants0.3500.7870.3360.4770.394
R&Ts0.8210.9560.7520.7870.769
WWTPs0.5340.8360.6330.4770.544
Overall0.5580.8710.5580.5950.562

How well does our baseline model do?

We experimented with a variety of models with a DenseNet-121 backbone which input combinations of image products, bands, image, and spatial resolutions. We found that a model which leverages NAIP with all four bands achieves the highest overall performance across the tested image product and spectral band combinations, followed closely by a joint NAIP, Sentinel-2, and Sentinel-1 model. We also found that the highest spatial resolution and footprint leads to the best overall performance, although performance can depend on the methane source category.

We selected the best performing setting for each methane source category in our baseline model. The baseline model achieved high performance in identifying concentrated animal feeding operations and oil refineries and petroleum terminals, suggesting the potential to map them at scale. There is still a large gap to achieving high performance for each of the other methane source categories and further improve performance on the high performing categories, so METER-ML is a challenging benchmark to test new infrastructure identification approaches.

To learn more, read our publication presented at the IJCAI-ECAI 2022 Workshop on Complex Data Challenges in Earth Observation.

If you have questions about our work, contact us at:

bwzhu@cs.stanford.edu and niclui@stanford.edu and jirvin16@cs.stanford.edu