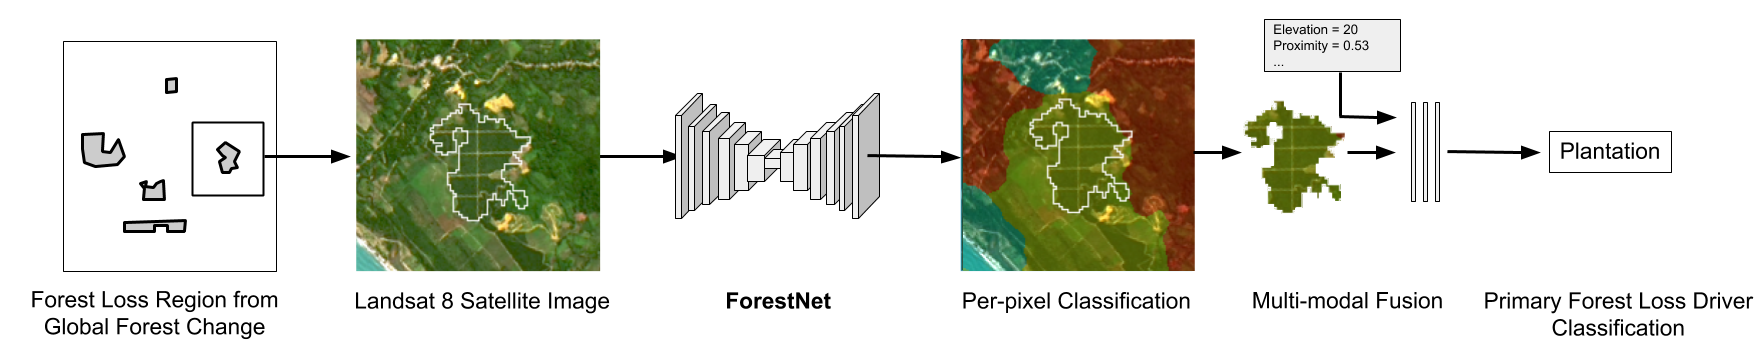
We developed a deep learning model called ForestNet to classify the drivers of deforestation using satellite imagery.

Characterizing the processes leading to deforestation is critical to the development and implementation of targeted forest conservation and management policies. Methods to automate forest loss driver classification enable spatially-broad and temporally-dense driver attribution with significant implications on forest conservation policies.

Read The Paper (Irvin & Sheng et al.)

We curated a dataset of satellite imagery with expert forest loss driver annotations.

The dataset consists of 2,756 satellite images of forest loss events with driver annotations. Global Forest Change (GFC) published maps were used to obtain forest loss events, each represented as a polygon and associated with a year indicating when the forest loss event occurred. An expert interpreter annotated each event with the direct driver of deforestation using high resolution satellite imagery from Google Earth. The driver annotations were grouped into Plantation, Smallholder Agriculture, Grassland/shrubland, and Other.

We captured each forest loss region with Landsat 8 satellite imagery acquired within five years of the event’s occurrence using a custom cloud-minimizing search procedure. Using this procedure, we obtained exactly one composite image for each example and additional images for any individual cloud-filtered scenes. Imagery was processed and downloaded using the Descartes Labs platform. The dataset can be downloaded below (CC BY 4.0 License).

Download the Dataset

ForestNet uses scene data augmentation, transfer learning, and multi-modal fusion.

We trained deep learning models on the dataset to classify satellite imagery of forest loss events. Instead of a canonical multi-class classification approach, we formulate the task as semantic segmentation to (1) address that there are often multiple land uses within a single image, (2) implicitly utilize the information specific to the loss region, and (3) allow for high resolution (15m) predictions that can be used to predict different drivers for multiple loss regions of varying sizes. At test-time, the per-pixel model predictions in the forest loss region are used to obtain a single classification of the whole region.

We investigated the effect of (a) using scene data augmentation (SDA) where we randomly sample from the scenes and composite images during training to capture changes in landscape over time, (b) pre-training (PT) the model on a large land cover dataset in Indonesia that we curated, and (c) using multi-modal fusion with a variety of auxiliary predictors.

ForestNet achieves higher classification performance than standard driver classification models.

Following recent work on automatically classifying land-use conversion from deforestation, we developed random forest (RF) models that input various variables, including topographic, climatic, soil, accessibility, proximity, and spectral imaging predictors. We found that all of the CNN models outperformed the RF models on the validation set.

The best performing model, which we call ForestNet, used a Feature Pyramid Network architecture with an EfficientNet-B2 backbone. The use of SDA provided large performance gains on the validation set, and land cover pre-training and incorporating auxiliary predictors each led to additional performance improvements.

Table 1. Accuracy and F1 scores on the validation and test sets.

Model Predictors ValTest
AccF1AccF1
RFVisible0.560.490.490.44
RF Visible + Aux0.720.670.670.62
CNN Visible0.800.750.780.70
CNN + SDA Visible0.820.790.780.73
CNN + SDA + PT Visible0.830.800.800.74
CNN + SDA + PT Visible + Aux0.840.810.800.75

To learn more, read our publication presented at the NeurIPS 2020 workshop on Tackling Climate Change with Machine Learning.

If you have questions about our work, contact us at:

jirvin16@cs.stanford.edu and haosheng@cs.stanford.edu