A new machine learning approach to make forecasts of time to event.

Probabilistic forecasts of time to event (such as mortality) can be crucial in healthcare. A forecast is only useful if it is calibrated, meaning that predicted probabilities match real world frequencies (for example, among all the days that had a rain forecast of 80%, approximately 8 of 10 times it actually rained). If calibrated, a forecast's usefulness increases with its confidence (it is useless to always predict the long term average of rain, even though such a forecast would be well-calibrated). The field of meteorology has developed mathematical tools (such as the CRPS) to increase confidence in weather forecasts while maintaining calibration. We extend these tools to handle partial observations (a.k.a. censoring), thus making them suitable for use with time to event forecasting. We call this Survival-CRPS, and apply by training a Recurrent Neural Network (RNN) to predict time to mortality for millions of patients using their Electronic Health Record (EHR) data.

Read our paper

We introduce two techniques for more confident forecasts.

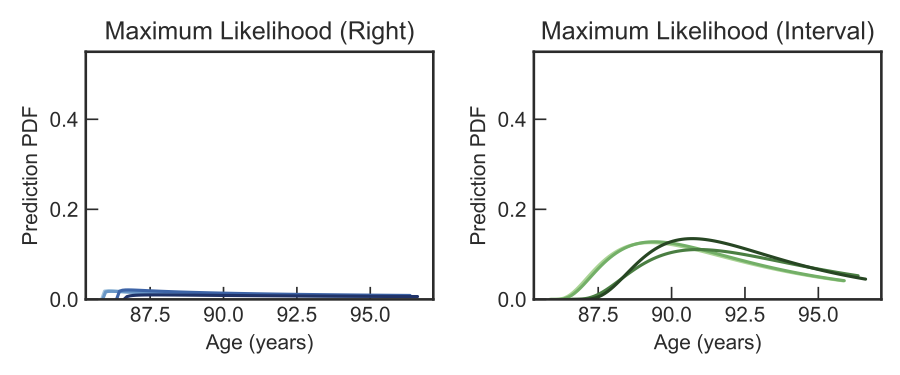
Maximum Likelihood Estimation (MLE), the most common approach in machine learning, fails to work well for forecasting time to all-cause mortality with EHR data. This is because, in real world EHRs, the vast majority of the patients are alive. In low prevalence conditions, the mathematical properties of MLE tend to make survival forecasts that can be wildly unreasonable (for example, predicting the expected age-of-death to be many hundreds of years). Even though such forecasts are technically calibrated, this makes naive MLE based survival predictions practically unusable.

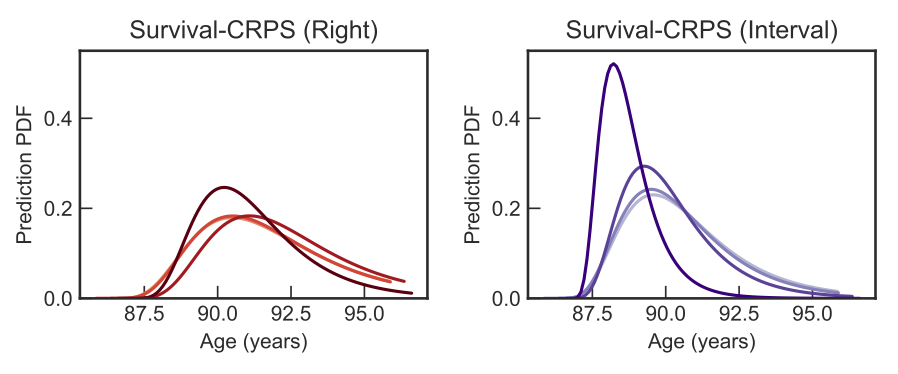
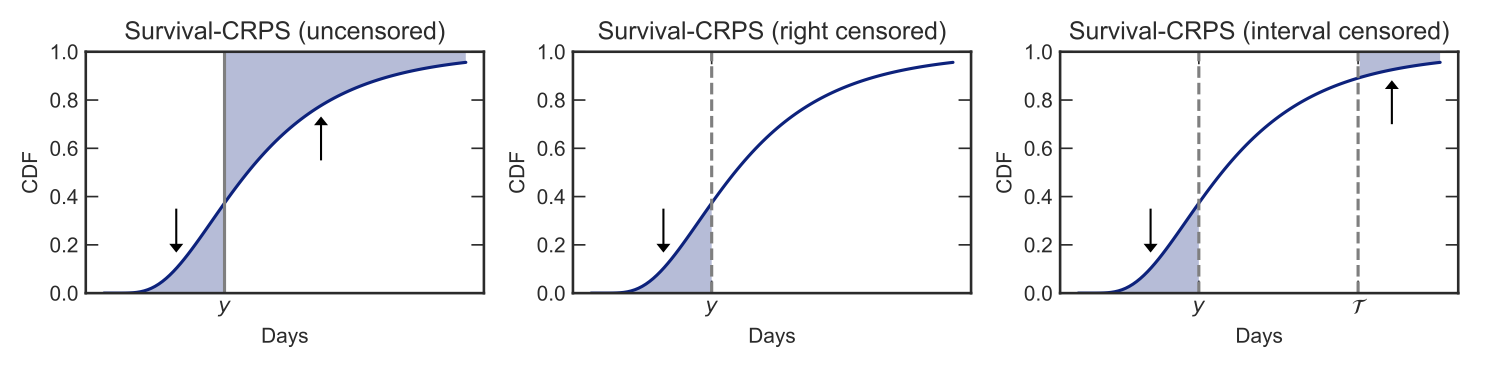
We present two independent techniques to improve the confidence of predictions in this scenario. First, we use our Survival-CRPS objective in place of MLE. Second, based on the fact that humans generally do not live past 120 years of age, we create Interval Censored variants of both Survival-CRPS and MLE. The two techniques independently, and jointly, improve the quality of survival predictions.

In this figure, we show examples of a patient's predicted distributions for age of death under different models. Repeated interactions (indicated by darker color) between the patient and the EHR yield more confident predictions of time of death.

The Survival-CRPS score: graphical intuition.

Our proposed Survival-CRPS score is best understood with a visualization of the Cumulative Distribution Function (CDF) of the forecast. As illustrated in the first figure, the original CRPS objective optimizes the forecast distribution to minimize the shaded area around Y, the actual outcome.

The Survival-CRPS is a generalization of this approach, as shown in the next two figures. It optimizes the forecast distribution to minimize the shaded regions only over those time periods where we are certain that the event (e.g death) has either not yet occured, or has already occurred (e.g the age at which the person turns 120 years).

Sequential predictions over hospital interactions with Recurrent Neural Networks.

The RNN architecture is a natural fit for modeling data over time (such as patients making several visits to a hospital). We show that the model learns to make more confident predictions for the same patient given more history. This is illustrated in these pictures of six random patients, where the X-axis is the visit number of the patient, and in the Y-axis we plot the actual time to death (red line) and the corresponding forecasts (mean, upper and lower bounds of the 95% prediction interval). The sequential and monotonically decreasing set of time to event predictions in such an RNN model inspires the name Countdown Regression.

Read our paper

If you have questions about our work, contact us at:

avati@cs.stanford.edu