MURA (musculoskeletal radiographs) is a large dataset of bone X-rays. Algorithms are tasked with determining whether an X-ray study is normal or abnormal.
Musculoskeletal conditions affect more than 1.7 billion people worldwide, and are the most common cause of severe, long-term pain and disability, with 30 million emergency department visits annually and increasing. We hope that our dataset can lead to significant advances in medical imaging technologies which can diagnose at the level of experts, towards improving healthcare access in parts of the world where access to skilled radiologists is limited.
MURA is one of the largest public radiographic image datasets. We're making this dataset available to the community and hosting a competition to see if your models can perform as well as radiologists on the task.
Update: This competition is now closed.
MURA uses a hidden test set for official evaluation of models. Teams submit their executable code on Codalab, which is then run on a test set that is not publicly readable. Such a setup preserves the integrity of the test results.
Here's a tutorial walking you through official evaluation of your model. Once your model has been evaluated officially, your scores will be added to the leaderboard.
Will your model perform as well as radiologists in detecting abnormalities in musculoskeletal X-rays?
| Rank | Date | Model | Kappa |
|---|---|---|---|
| Best Radiologist Performance Stanford University Rajpurkar & Irvin et al., 17 | 0.778 | ||
| 1 | Nov 30, 2018 | base-comb2-xuan-v3(ensemble) jzhang Availink | 0.843 |
| 2 | Nov 06, 2018 | base-comb2-xuan(ensemble) jtzhang Availink | 0.834 |
| 3 | Oct 06, 2018 | muti_type (ensemble model) SCU_MILAB | 0.833 |
| 4 | Oct 02, 2018 | base-comb4(ensemble) jtzhang Availink | 0.824 |
| 5 | Nov 08, 2018 | base-comb2-jun2(ensemble) | 0.814 |
| 5 | Nov 07, 2018 | base-comb2-ping(ensemble) | 0.814 |
| 6 | Aug 22, 2018 | base-comb3(ensemble) | 0.805 |
| 7 | Sep 14, 2018 | double_res(ensemble model) SCU_MILAB | 0.804 |
| 8 | Aug 24, 2018 | double-dense-Axy-Axyf512 ensemble | 0.795 |
| 9 | Jul 24, 2018 | densenet169_v2/single model | 0.775 |
| 10 | Aug 19, 2018 | ianpan (ensemble) RIH 3D Lab | 0.774 |
| 11 | Jul 24, 2018 | inceptionv3/single model | 0.774 |
| 12 | Jun 17, 2018 | gcm (ensemble) Peking University | 0.773 |
| 12 | Sep 10, 2018 | ty101 single model | 0.773 |
| 13 | Aug 31, 2018 | he_j | 0.764 |
| 13 | Aug 31, 2018 | AIAPlus (ensemble) Taiwan AI Academy http://aiacademy.tw | 0.764 |
| 14 | Sep 04, 2018 | SER_Net_Baseline (single model) SJTU | 0.764 |
| 15 | Jul 14, 2018 | Trs (single model) SCU_MILAB | 0.763 |
| 16 | Sep 12, 2018 | null | 0.763 |
| 16 | Aug 21, 2018 | densenet single model unknown | 0.763 |
| 17 | Jul 16, 2018 | null | 0.755 |
| 17 | Aug 24, 2018 | dense-sep-xyz ensemble | 0.755 |
| 18 | Nov 16, 2018 | VGG19 single model | 0.754 |
| 19 | Jul 25, 2018 | DenseNet001 (single model) zhou | 0.747 |
| 20 | Aug 21, 2018 | dn169-Aftrva(single) AliHealth | 0.747 |
| 21 | Jul 14, 2018 | type_resnet (single model) CCLab | 0.746 |
| 22 | Dec 06, 2018 | res101_da_sqtv(single) | 0.746 |
| 23 | Jun 18, 2018 | VGG19 (single model) ZHAW | 0.744 |
| 24 | Jul 02, 2018 | ImageXrModel-001 (single model) Ruslan Baikulov | 0.737 |
| 25 | Oct 04, 2018 | ExtremityModel ensemble | 0.734 |
| 26 | Jan 19, 2019 | DenseAttention (single model) BIT | 0.727 |
| 26 | Aug 12, 2018 | base169-AllParts-diffParts-tv(ensemble) MSFT-research | 0.727 |
| 27 | Sep 27, 2018 | aiinside | 0.725 |
| 27 | Mar 14, 2019 | Resology14 (ensemble) Rology http://www.rology.net | 0.725 |
| 28 | Dec 06, 2018 | inc3_sqtv(single) MIT AI | 0.724 |
| 29 | Aug 21, 2018 | base-model-Atv(single) Avail-AI | 0.717 |
| 30 | Dec 11, 2018 | incev3_xy(single) UCB | 0.716 |
| 31 | Jul 18, 2018 | nasnet_mobile/single model | 0.712 |
| 32 | Mar 14, 2019 | kmle-second (ensemble) kmle | 0.707 |
| 33 | Jul 30, 2018 | dn169-baseline (single model) PKU | 0.707 |
| 34 | May 23, 2018 | Stanford Baseline (ensemble) Stanford University https://arxiv.org/abs/1712.06957 | 0.705 |
| 35 | Mar 10, 2019 | asa_model_nasnetmo (single) toyohashi | 0.702 |
| 36 | Jul 11, 2018 | mobilenet/single model | 0.701 |
| 36 | Jul 16, 2018 | type_inception2(single model) CCLab | 0.701 |
| 37 | Dec 06, 2018 | term2-model0sqtv(single) | 0.700 |
| 38 | Jun 24, 2018 | single-densenet169 single model | 0.699 |
| 39 | Oct 26, 2018 | Joint-tv single | 0.698 |
| 39 | Aug 17, 2018 | base ensemble | 0.698 |
| 39 | Aug 21, 2018 | baseAllPartsDiffParts-sq ensemble | 0.698 |
| 39 | Aug 09, 2018 | base169-AllParts-diffParts(ensemble) MSFT-reseach | 0.698 |
| 39 | Jul 02, 2018 | Baseline169 (single model) Personal | 0.698 |
| 40 | Jan 18, 2019 | first-attempt-kmle (ensemble) kmle | 0.696 |
| 41 | Dec 31, 2018 | DenseNet_144 single model http://www.rology.net/ | 0.694 |
| 42 | Jul 22, 2018 | Densenet DI-MT Single | 0.690 |
| 43 | Jul 13, 2018 | dense169(ensemble) mitAI | 0.686 |
| 44 | Oct 27, 2018 | xception(single model) bimal | 0.686 |
| 45 | Dec 23, 2018 | {EnglebertDGC} (single model) UCLouvain | 0.684 |
| 46 | Dec 06, 2018 | res_daxy(single) CMU ml | 0.680 |
| 47 | Jan 16, 2019 | GoGoing (ensemble) Inner Mongolia University | 0.678 |
| 48 | Dec 11, 2018 | inceptionresnetv2_tv(single) baidu AI | 0.676 |
| 49 | Jun 10, 2018 | ResNet (single model) UCSC CE graduate student huimin yan | 0.675 |
| 49 | Aug 18, 2018 | {monica_v1}(single model) Zzmonica | 0.675 |
| 50 | Jul 09, 2018 | null | 0.664 |
| 51 | Jan 11, 2019 | PFResNet (single model) USTC_Math_1222 | 0.664 |
| 52 | Nov 29, 2018 | {DenseNet_169} (single model) Rology http://www.rology.net | 0.662 |
| 53 | Jan 31, 2019 | DenseNet_v2 single model http://www.rology.net | 0.661 |
| 54 | Sep 03, 2018 | DenseNet002 (single model) zhou | 0.660 |
| 55 | Nov 05, 2018 | DenseNet (single model) Rology http://www.rology.net/ | 0.659 |
| 56 | Jun 30, 2018 | Baseline169-v0.2 (single) Personal | 0.659 |
| 57 | Jul 08, 2018 | madcarrot | 0.653 |
| 58 | Dec 06, 2018 | base_largexy(single) Tsinghua Deep Learning | 0.652 |
| 59 | Jun 30, 2018 | zhy | 0.638 |
| 60 | Jun 30, 2018 | Densenet121 (single model) Personal | 0.629 |
| 61 | Oct 26, 2018 | baseJoint-tvsq(single) ali | 0.624 |
| 62 | Dec 31, 2018 | ConvNet single model http://www.rology.net/ | 0.599 |
| 63 | Jan 31, 2019 | Ensemble_V0 ensemble model http://www.rology.net/ | 0.599 |
| 64 | Aug 29, 2018 | Inception-ResNet-v2 (single model) Royal Holloway | 0.597 |
| 64 | Aug 28, 2018 | Inception-ResNet-v2 (single model) Royal Holloway | 0.597 |
| 65 | Jul 26, 2018 | Bhaukali_v1.0 (single model) IIT BHU, Varanasi | 0.581 |
| 66 | Jul 21, 2018 | inceptionv3-pci (single model) PCI | 0.578 |
| 67 | Jul 12, 2018 | DN169 single | 0.574 |
| 68 | Jul 31, 2018 | Densenet169-lite(single model) Tang | 0.560 |
| 69 | Aug 29, 2018 | ensemble1 ensemble | 0.534 |
| 70 | Jul 06, 2018 | DenseNet (single model) Zhou | 0.518 |
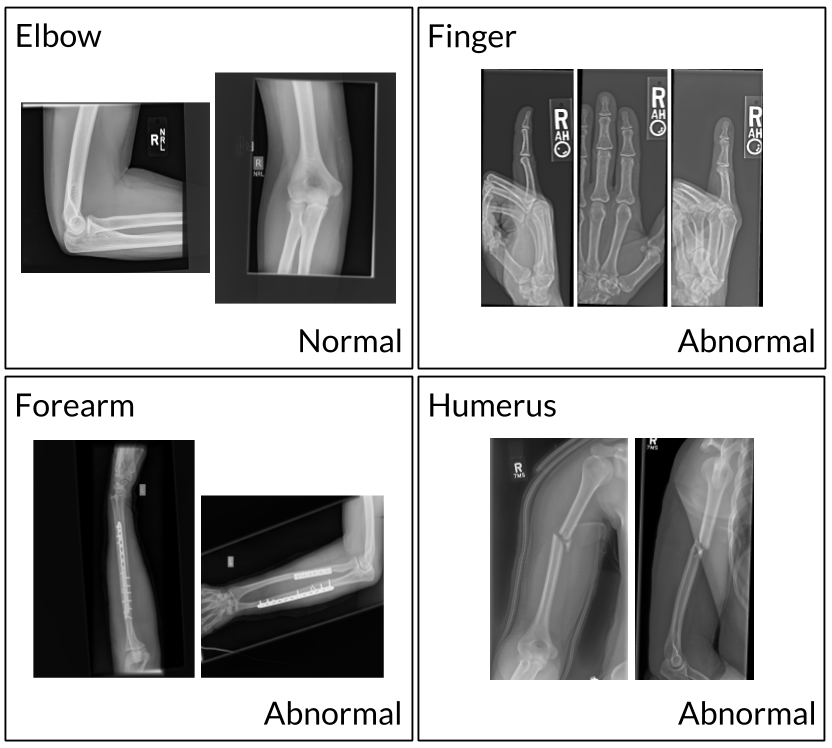
MURA is a dataset of musculoskeletal radiographs consisting of 14,863 studies from 12,173 patients, with a total of 40,561 multi-view radiographic images. Each belongs to one of seven standard upper extremity radiographic study types: elbow, finger, forearm, hand, humerus, shoulder, and wrist. Each study was manually labeled as normal or abnormal by board-certified radiologists from the Stanford Hospital at the time of clinical radiographic interpretation in the diagnostic radiology environment between 2001 and 2012.
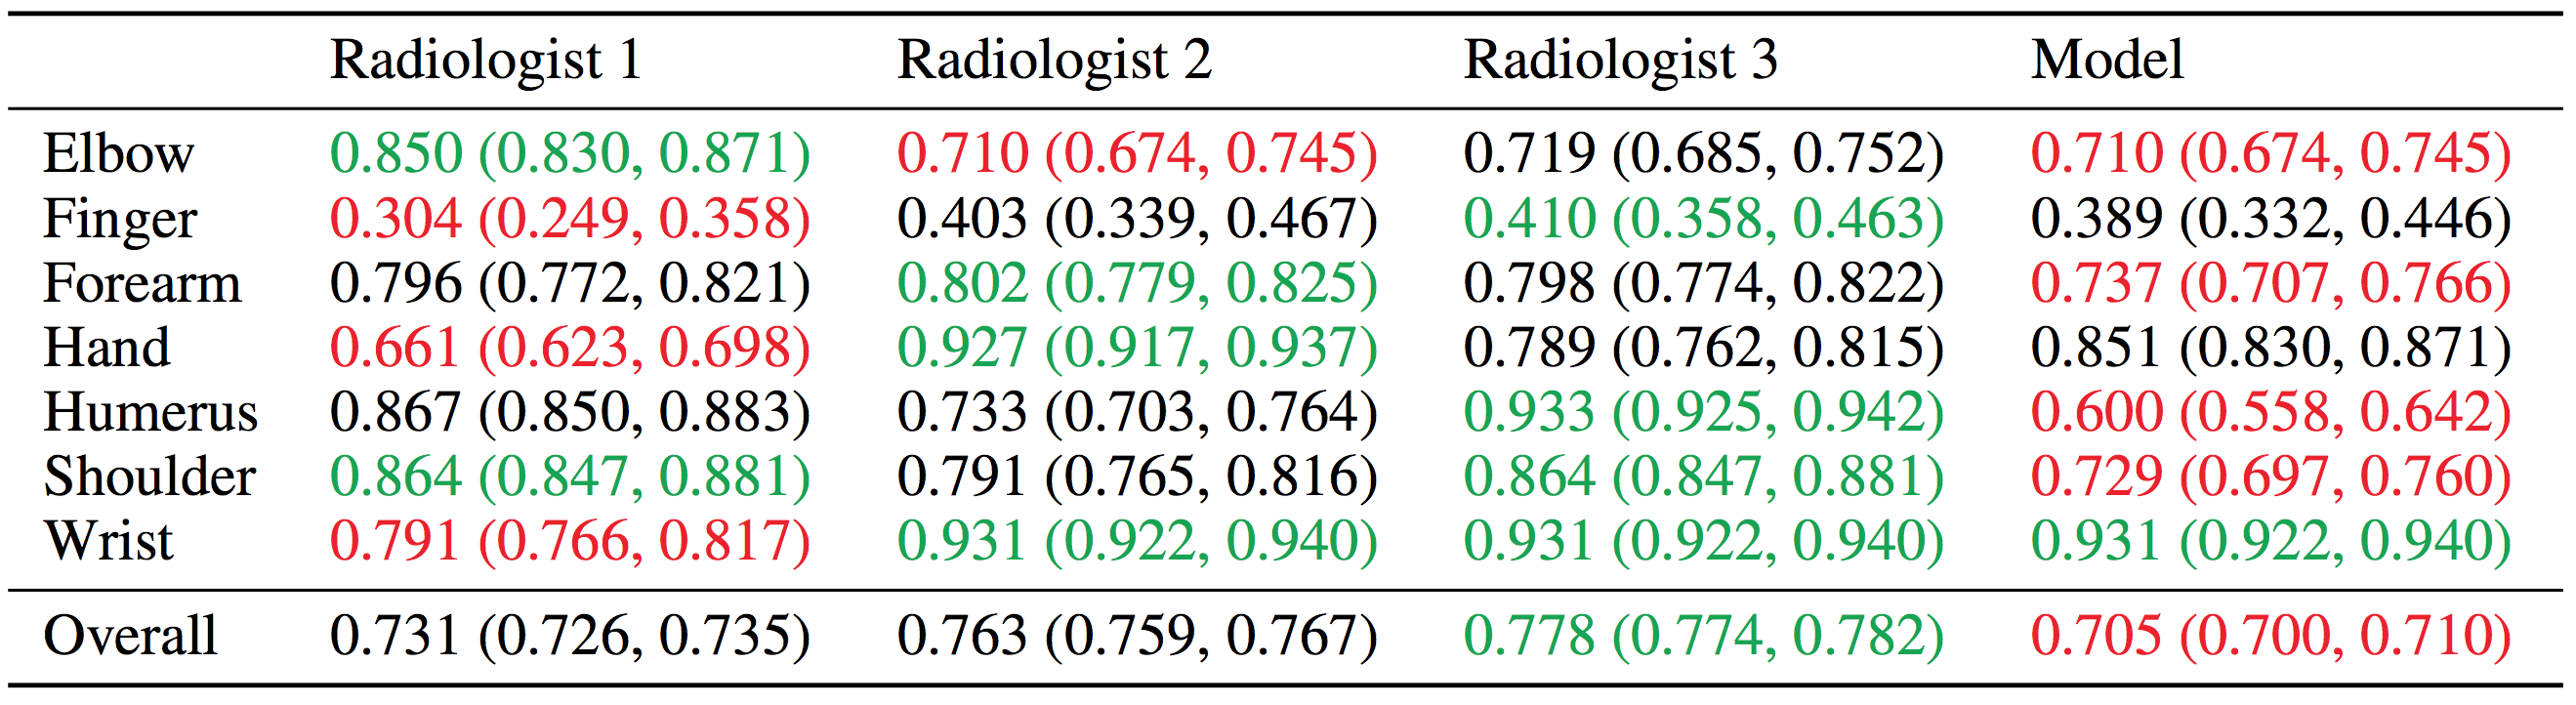
To evaluate models and get a robust estimate of radiologist performance, we collected additional labels from six board-certified Stanford radiologists on the test set, consisting of 207 musculoskeletal studies. The radiologists individually retrospectively reviewed and labeled each study in the test set as a DICOM file as normal or abnormal in the clinical reading room environment using the PACS system. The radiologists have 8.83 years of experience on average ranging from 2 to 25 years. We randomly chose 3 of these radiologists to create a gold standard, defined as the majority vote of labels of the radiologists.
Our baseline uses a 169-layer convolutional neural network to detect and localize abnormalities. The model takes as input one or more views for a study of an upper extremity. On each view, our 169-layer convolutional neural network predicts the probability of abnormality. We compute the overall probability of abnormality for the study by taking the arithmetic mean of the abnormality probabilities output by the network for each image. The model makes the binary prediction of abnormal if the probability of abnormality for the study is greater than 0.5.
The network uses a Dense Convolutional Network architecture, which connects each layer to every other layer in a feed-forward fashion to make the optimization of deep networks tractable. We replace the final fully connected layer with one that has a single output, after which we apply a sigmoid nonlinearity. We use Class Activation Maps to visualize the parts of the radiograph which contribute most to the model's prediction of abnormality.

We evaluated our baseline on the Cohen’s kappa statistic, which expresses the agreement of the model with the gold standard. Baseline performance is comparable to radiologist performance in detecting abnormalities on finger studies and equivalent on wrist studies. However, baseline performance is lower than best radiologist performance in detecting abnormalities on elbow, forearm, hand, humerus, shoulder studies, and overall, indicating that the task is a good challenge for future research.


Find the dataset on the Stanford AIMI website.
If you have questions about our work, contact us at our google group.
Read the Paper